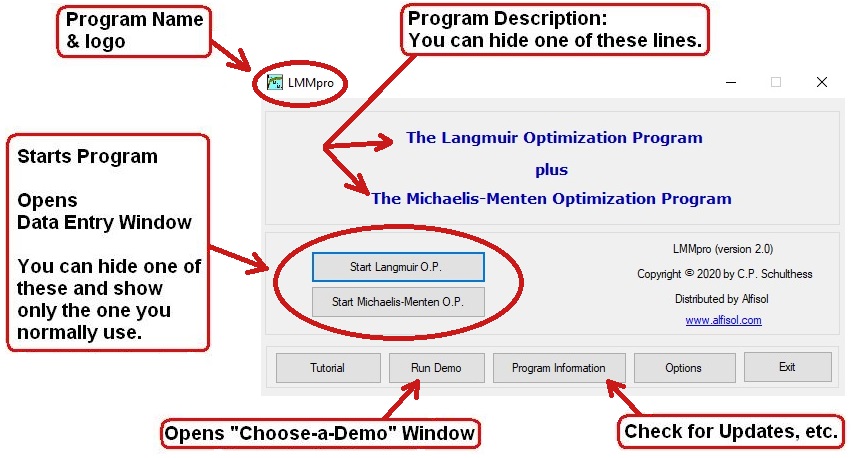
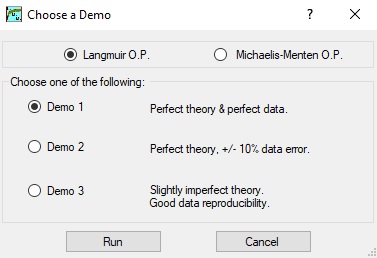
This is the main menu. Start the optimization program (o.p.) and enter your own data. Else, you can still click on "Run Demo" for your class lectures.
Click on "Options" to edit how the software performs, and on "Tutorial" for a detailed explanation of how the software works plus the theory behind it all.
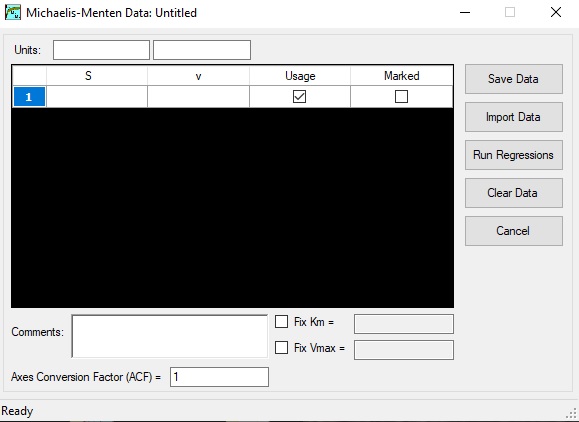
Import data or create your own data through the "Data Entry" window.
Data entry is easy to do, and there are also a few nice features included here.
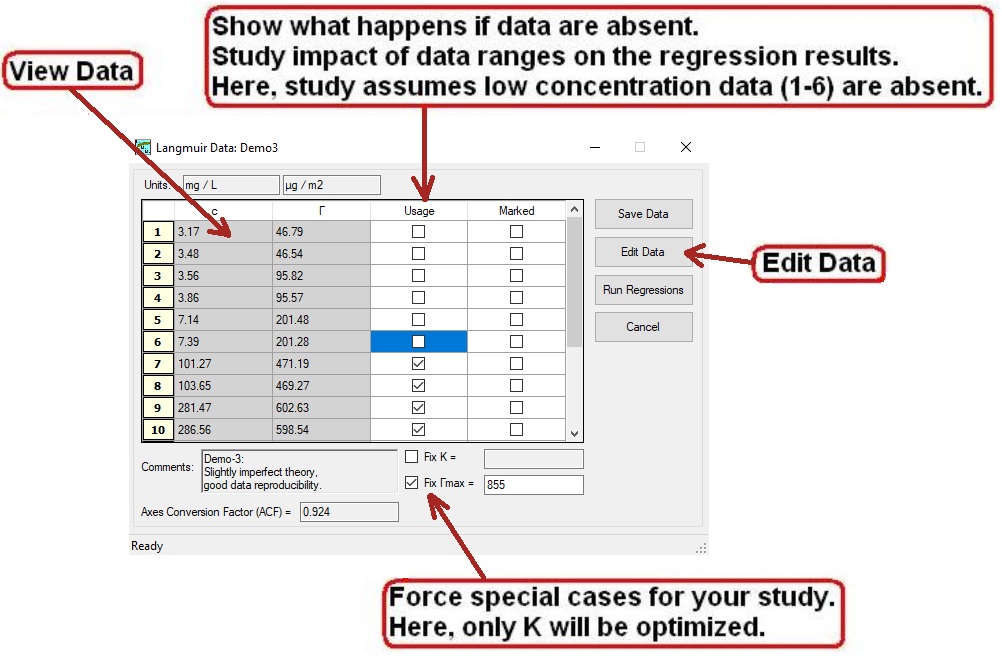
Naturally, you can always open a "Data Display" window, which allows you to very easily manipulate which data to use and which not to use. This allows you to explore various "what if" scenarios, which is extremely useful for teachers and interesting to students.
Researchers will also enjoy this "usage" option. It easily allows you, for example, to explore which data are impacting (biasing) the regression results and to what degree.
Another nice feature is the ability to fix one (or both) of the parameters. Wow! That's cool for teaching. It's also an obvious help for research objectives.
You can also edit the data.
All users have access to 3 demo data sets. These are particularly useful for teachers.
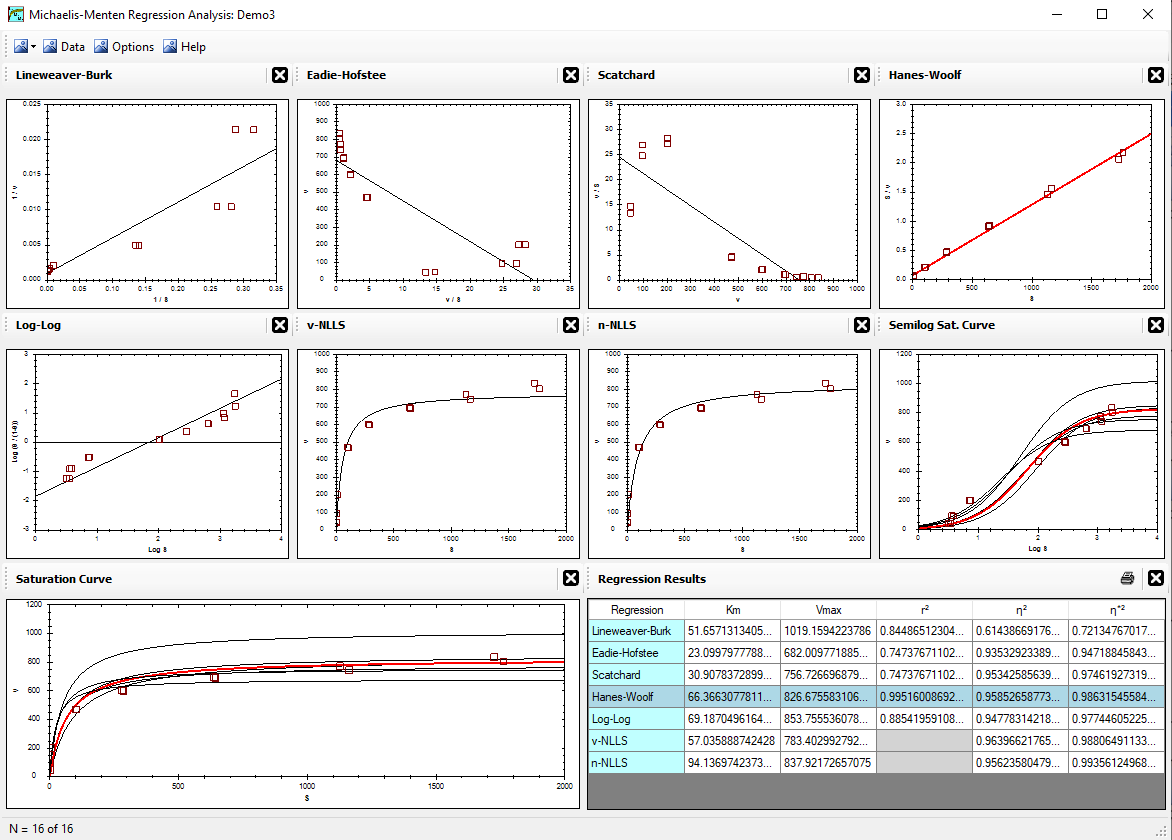
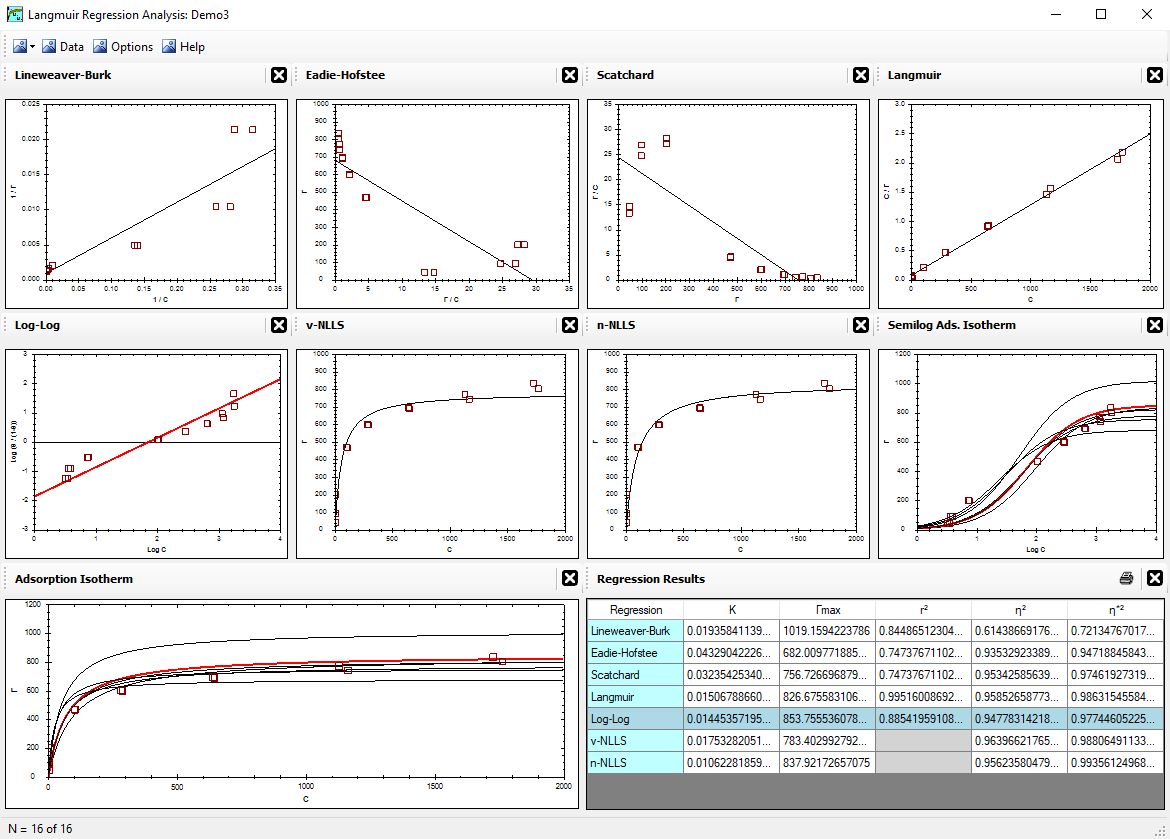
So what does it look like? Check out the results screens below. Note that each little box in the regression window can also be enlarged to full screen size.
Furthermore, there are various ways to highlight the data here.
View of Langmuir Adsorption Isotherm, Demo 3:
View of Michaelis-Menten Saturation Curve, Demo 3: