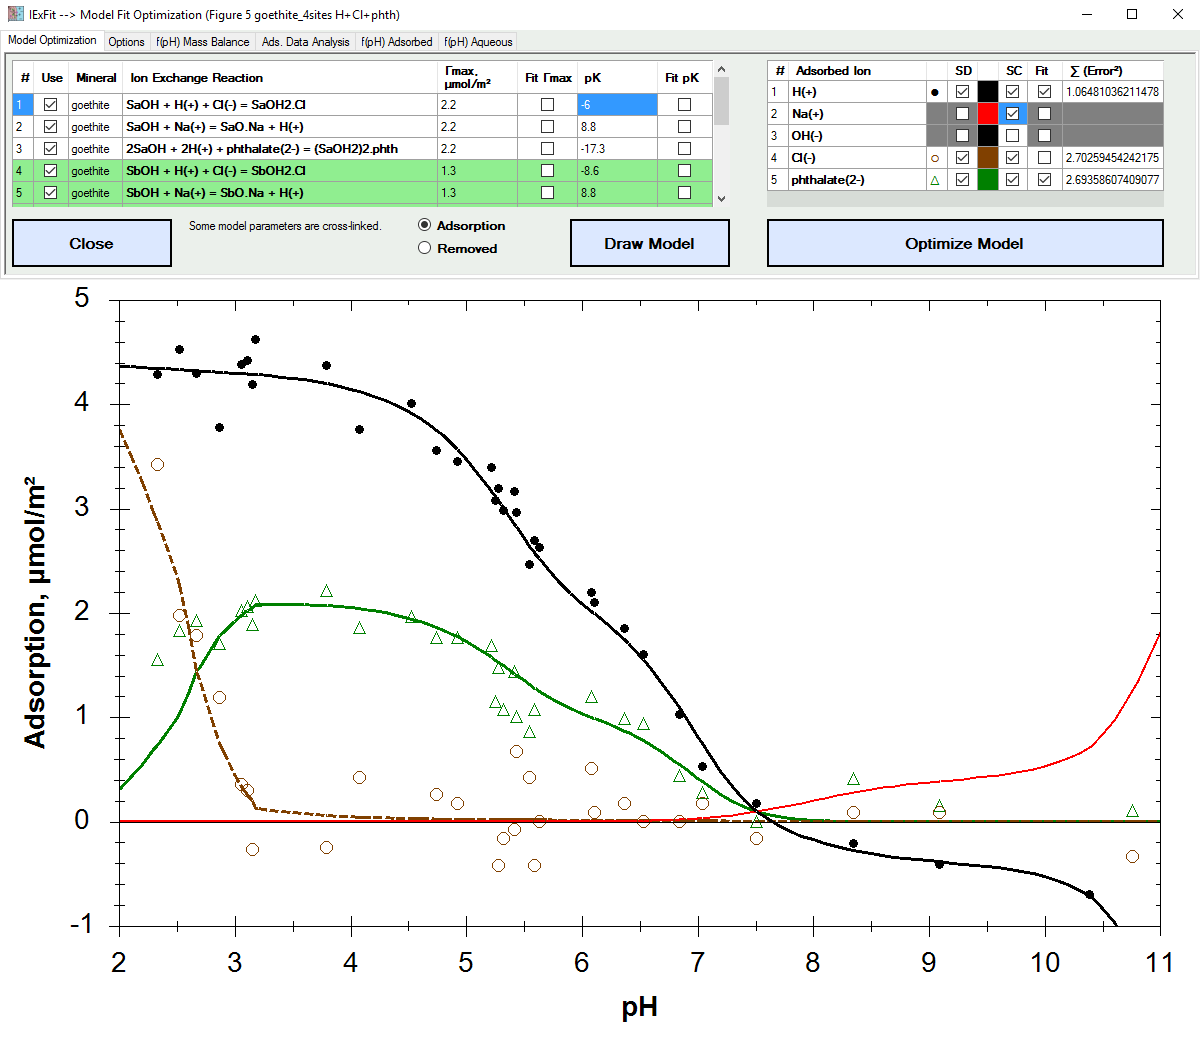
Fit adsorption data based on ion exchange reaction models.
Display solid & liquid & gas phase speciation diagrams as a funciton of pH & redox conditions.

| Alfisol, Item 007: | IExFit, version 3.4 Fit adsorption data based on ion exchange reaction models. Display solid & liquid & gas phase speciation diagrams as a funciton of pH & redox conditions. |
|
Software Overview |
|
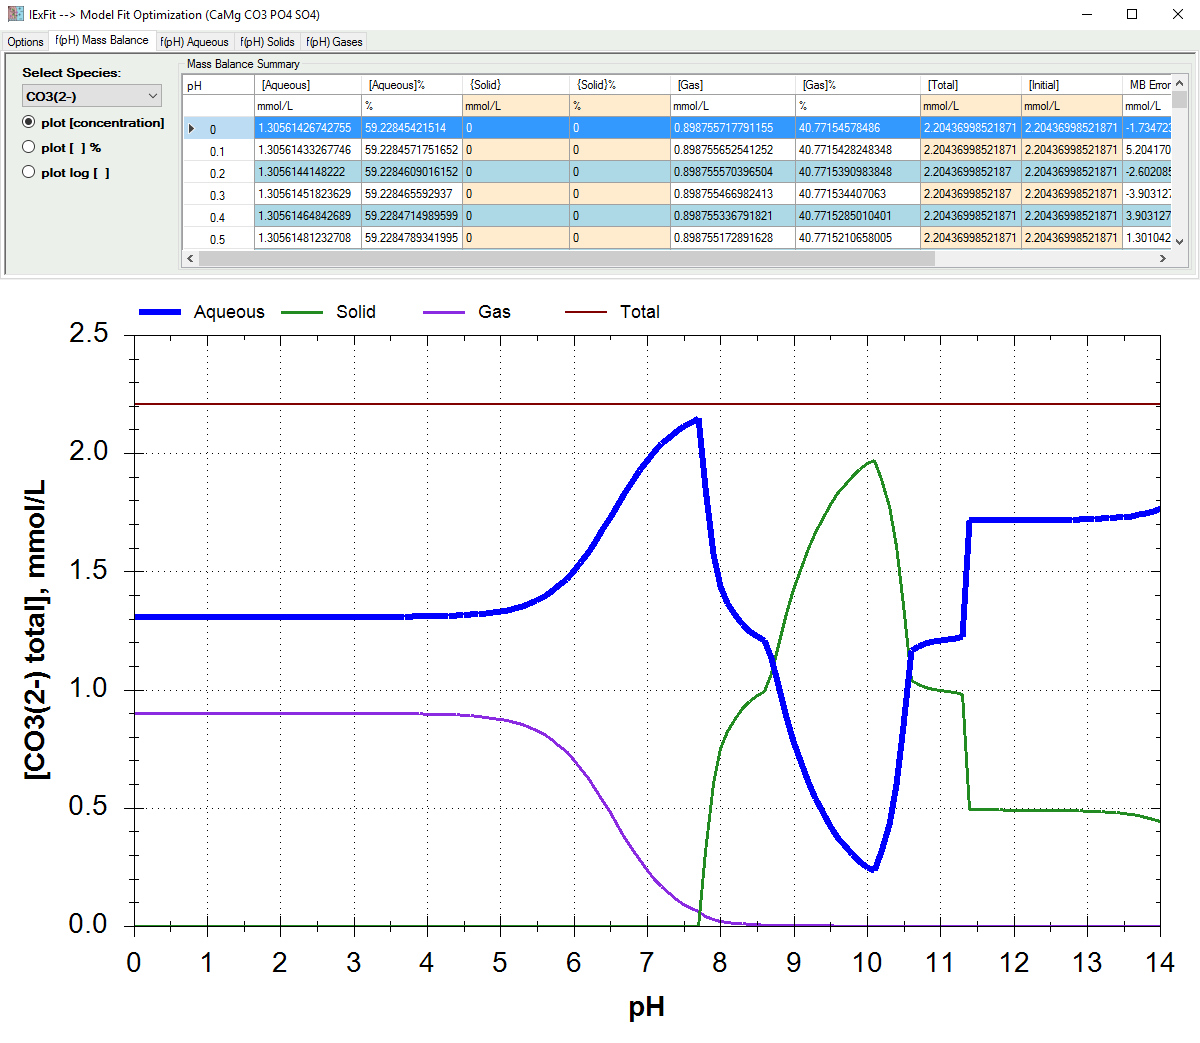
Click on the "f(pH) Mass Balance" tab to view the distribution of the ions. Specifically, show how much is adsorbed, how much is solid, how much is gaseous, and how much remains aqueous. It also shows how much is present in other reduced or oxidized species. The grid also shows the actual mass balance model criteria results for each pH value.
You can also select to show a tabulated "Error Summary" for each pH value calculation in the dropdown menu. This will give for each pH value the name of the component species that had the highest percent mass balance error and the name of the product species that had the highest percent change in concentration in the last convergence loop sequence. This option helps confirm that all the values calculated by IExFit are good to at least within the percent error values shown in the "Error Summary". The "Error Summary" option will also show charge balance data and graph.